

Experiments are an important way to validate marketing effectiveness measurement. This post will take you through some approaches to evaluating marketing uplift experiments.
Let’s assume you run a test TV / VOD campaign over 4 weeks in March 2025. How can you measure the sales revenue uplift it created? In this post, we’ll look at three ways to evaluate your marketing experiments:
- Year on Year measurement
- Causal impact studies
- Difference in Difference (DiD) regression
Option 1 – Year on Year uplift measurement
- Year on year measurement is a very simple and relative clean way to make empirical judgments about marketing and media campaign performance.
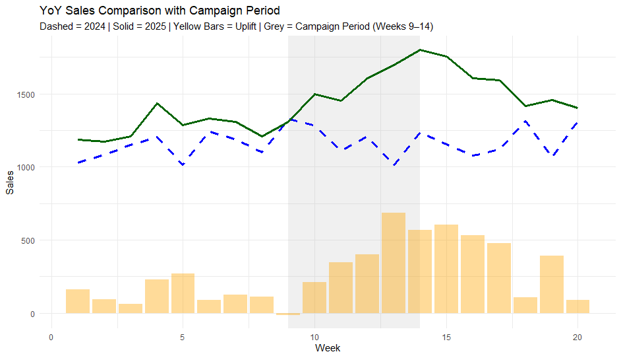
- We compare the sales pattern over time this year to the sales pattern over time last year.
- We chunk the data over time into three phases, pre-campaign (4-6 weeks before the campaign), in-campaign (4 weeks) and post-campaign (4-6 weeks after the campaign) – this latter stage is important as it captures post campaign effects.
- Using an analysis tool like R or Python we can produce the following Year on year uplift outputs:

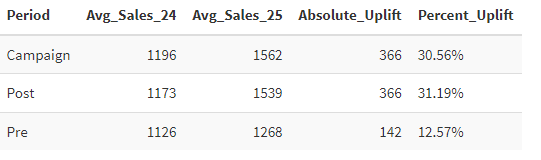
YoY Uplift Test table showing results detail
Option 2 – Causal Impact uplift measurement
- The principle behind this technique is the measurement of an intervention, where the intervention could be our new TV / VOD campaign.
- This technique estimates the levels of sales that would have been generated without the intervention and then estimates the weekly (pointwise) and cumulative (build) of sales after the intervention.
- Casual Impact is very useful as it doesn’t need YoY measurement, so it’s especially useful in launch situations where historical data is limited.
- Using an analysis tool like R or Python we can produce the following post intervention sales uplift outputs:

Causal Impact Test Example showing estimate of underlying sales without intervention and observed sales (top facet), with observed weekly sales in the middle facet and the cumulative incremental sales build over time in the bottom facet.
Option 3 – Difference Regression (DiD)
- Difference in Difference uses a regression approach to measure the difference in the changes between pre- and post-campaign periods during each year for 2024 and 2025.
- The DiD estimate subtracts the changes observed in 2024 from those observed in 2025 to calculate the campaign uplift.
- DiD automatically controls for underlying seasonality and year-on-year trends in the data because it is comparing changes within two different years.

Which option should we use?
Any of these options will give you a good measure of your campaign uplift, but once you have set up your tests, run them and collected and formatted your data, all three are relatively straightforward to run in a code environment. My recommendation – do all three.